Understanding GPU Metrics nvidia-smi vs OS: A Complete Guide
At the time of running heavy tasks on a GPU server—whether it’s a separate GPU dedicated server, a robust GPU cluster, or a cloud-based setup like all those that are provided by GPU4HOST—knowing about GPU utilization is very important. That’s where GPU Metrics nvidia-smi vs OS monitoring, plays an essential role.
This whole guide will completely break down how to interpret GPU performance and health with the help of two general sources: NVIDIA’s nvidia-smi usage and the Guest Operating System (OS) metrics. We will easily help you understand where each one of them outshines, what they really miss, and how to mix them for full-stack GPU visibility.
What Are GPU Metrics?
GPU metrics give valuable insights into your graphics processing unit’s performance, consisting of:
- GPU usage (% utilization over specific time)
- Memory utilization (VRAM usage)
- Power draw & temperature
- Process-level information (which application is utilizing what resources)
At the time of managing GPU servers—mainly enterprise-level setups such as NVIDIA A100, V100, or Quadro RTX A4000—tracking all essential metrics helps improve workloads, resolve slowdowns, and maintain good health for a long time.
Best Tools to Monitor GPU Metrics
To effortlessly track performance, you generally have two well-known sources:
- Guest OS-level tools (like top, htop, ps, or custom daemons)
- nvidia-smi (NVIDIA System Management Interface)
Let’s deeply dive into what both of them provide and why comparing GPU Metrics nvidia-smi vs OS is so helpful.
What is nvidia-smi?
nvidia-smi is basically a command-line utility that always comes bundled with the NVIDIA GPU drivers. It works directly with the GPU and gives near-real-time hardware-level metrics.
What nvidia-smi Displays:
- Name of GPU & driver version
- Power utilization & temperature
- Total and utilized VRAM
- Active processes utilizing the GPU
- PCIe bandwidth stats
- Clock speeds (core/memory)
For instance:
nvidia-smi
The result of this will be something like this:
+—————————————————————————–+
| NVIDIA-SMI 470.57.02 Driver Version: 470.57.02 CUDA Version: 11.4 |
|——————————-+———————-+———————-+
| GPU Name Persistence-M| Bus-Id Disp.A | Volatile Uncorr. ECC |
| Fan Temp Perf Pwr:Usage/Cap| Memory-Usage | GPU-Util Compute M. |
|===============================+======================+======================|
| 0 NVIDIA A100 On | 00000000:3D:00.0 Off | 0 |
| 35% 65C P2 250W / 400W | 24576MiB / 40960MiB | 95% Default |
+——————————-+———————-+———————-+
Why it truly matters:
For those systems that are using GPU4HOST or self-hosted GPU clusters, this tool gives direct hardware readings that you can’t get from standard OS tools.
What Does the Guest OS Show?

The guest operating system ( Windows or Linux) utilizes traditional tools (such as top, htop, ps, task manager, or personalized monitoring agents) to check process-level CPU, memory, and GPU utilization.
What OS-Level Monitoring Displays:
- Complete system CPU & RAM utilization.
- Which process is currently running (PID, user)
- GPU utilization via utilities such as gpustat or integrations like Prometheus + DCGM
- Several Docker-aware GPU metrics (for containerized applications)
Example utilizing gpustat:
gpustat
Result:
gpu0 NVIDIA A100 | 65°C, 250W / 400W | 95 % Util | 24.5 GB / 40.9 GB | python/12345
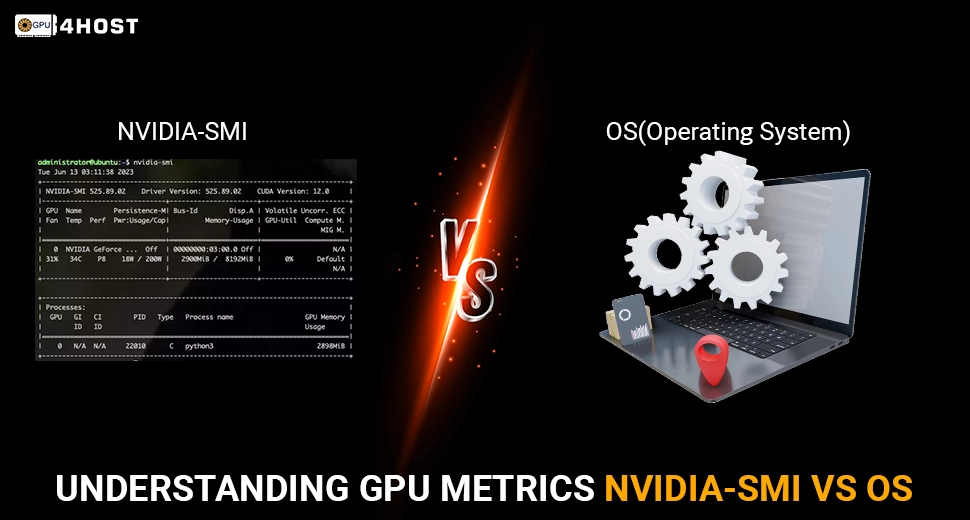
GPU Metrics nvidia-smi vs OS: What’s the Actual Difference?
Here’s a complete breakdown to help you know about the main difference between GPU Metrics nvidia-smi vs OS monitoring:
| Feature | nvidia-smi | Guest OS Tools |
| Accuracy | Straight from NVIDIA driver | May change, usually approximated |
| GPU Memory/Utilization | Yes | Yes (with the help of wrapper tools) |
| Temperature & Power | Yes | No (or restricted support) |
| Historical Metrics | No (unless logged) | Possible with monitoring stacks |
| Container Awareness | No (general) | Yes (Docker, Kubernetes) |
| Process-Level GPU Stats | Yes | Yes |
| Automation-Friendly | Yes (–query options) | Yes |
Practical Guide: Utilizing GPU Metrics in Real Scenarious
Let’s say you’re handling a GPU dedicated server powered by the NVIDIA V100 GPU for deep learning inference. Here’s how you’d mix both tools:
Situation 1: Debugging Performance Drop
- Utilize nvidia-smi to opt for GPU usage and temperature.
- Utilize htop + gpustat to map processes to apps.
- Analyze bottlenecks (for example, overused memory or overheated GPU).
Situation 2: Monitoring a GPU Cluster (for example, via GPU4HOST)
- Utilize nvidia-smi –loop=5 to easily stream real-time hardware data.
- Utilize Prometheus/Grafana to check OS-level stats over time.
- Use DCGM (Data Center GPU Manager) for thorough metrics on clusters.
Modern Use: Scripted Monitoring
Both OS tools and nvidia-smi can be easily scripted to automate warnings and dashboards.
#!/bin/bash
while true
do
nvidia-smi –query-gpu=utilization.gpu,memory.used –format=csv,noheader,nounits >> gpu_usage.log
sleep 60
done
Utilize this simultaneously with your OS tools to log memory, performance, and temperature on NVIDIA GPUs such as the Quadro RTX A4000, etc.
Why Accuracy Is Important in GPU Monitoring

If you are a data scientist training models, a DevOps engineer handling GPU servers, or a service provider like GPU4HOST, precise metrics help with:
- Cost handling (avoid over-provisioning)
- Performance tuning (improve TFLOPs)
- Thermal management (prevent throttle)
- Avoiding system crashes
Selecting between both GPU metrics nvidia-smi vs OS shouldn’t be an either-or decision—they generally complement each other.
Best Practices for Tech Experts
- Use Both Tools Together: Mix nvidia-smi for hardware insights and OS-level tools for app-based context.
- Log Constantly: Utilize –loop, Prometheus, or your personalized log parser.
- Tag Everything: Explain logs with server names (for example, “GPU4HOST-A100-Node3”) for easy traceability.
- Check Environmentals: Don’t only monitor the GPU—also keep an eye on the node’s CPU, RAM, and disk I/O too.
- Automate Alerts: Set thresholds for temperature, power, and usage.
Final Thoughts
If you are constantly running heavy tasks on a GPU server, knowing how to read GPU metrics precisely can save a lot of time and assets and prevent long-term failures. The GPU Metrics nvidia-smi vs OS comparison is not all about choosing a specific winner—it’s about utilizing the correct tool for the correct layer.
Even if you are purchasing from GPU4HOST, handling your own GPU cluster, or testing with NVIDIA V100, A100, or other models, this knowledge base makes sure that your GPU monitoring setup is completely smart, practical, and performance-centered.


